Transforming Business Processes Through Data Integration and Analysis
In the information age, transforming business processes through the strategic implementation of data integration and analysis has become essential to optimize operations and business decisions. From data visualization to ETL (Extract, Transform, Load) processes, and predicting market trends, each aspect of data management has become a fundamental pillar for companies seeking a competitive edge.
Data Integration: The Basis for Effective Transformation
The unification of data from different sources is the first critical step in transforming business processes. Companies often operate in data silos, where critical information remains isolated in different departments. Integrating this data allows for a holistic view of the business, crucial for making informed and consistent decisions.
Data Visualization:
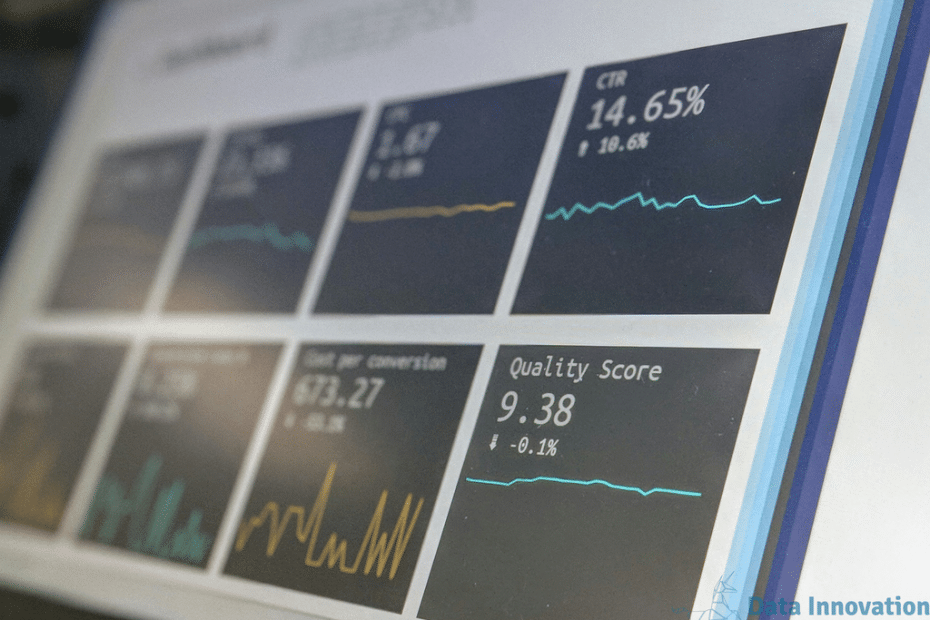
Visualization is a powerful tool for interpreting large volumes of data and transforming them into actionable insights. Tools like Tableau, Microsoft Power BI, or QlikView facilitate the graphical representation of data, allowing stakeholders to quickly grasp trends, outliers, and patterns.
Visualization Example: Imagine a dashboard that displays real-time sales performance by regions, product categories, and sales channels. Each segment of the chart can be explored to break down the underlying data and better understand the business drivers.
ETL Processes: The Backbone of Data Analytics
The ETL process enables companies to extract data from various sources, transform it according to specific needs, and load it into a system for analysis. This process is fundamental when preparing data for complex analyses, including:
- Extraction: Gathering data from disparate sources such as databases, CSV files, or even real-time data streams.
- Transformation: Data cleaning (such as removing duplicates, correcting errors), and transformation (changing formats, creating new columns from existing data).
- Loading: Inserting the transformed data into a new repository, often a data warehouse, where it can be easily accessed by analytical tools.
Practical ETL Example: A retail company might extract daily sales data, customer demographic data, and inventory data, transform these data to reflect key metrics, and then load them into a data warehouse where analysts can perform analyses to optimize inventory and marketing strategies.
Market Trend Prediction
The ability to predict future market trends using historical data is a significant advantage. Through machine learning techniques and statistical modeling, companies can anticipate changes in consumer preferences, product demand, or even foresee market fluctuations.
Prediction Example: Using historical sales data and applying time series models, a company could forecast future sales for the next quarter, adjusting production and marketing strategies accordingly to maximize profits.
Conclusion
The transformation of business processes through data integration and analysis not only improves operational efficiency but also amplifies a company’s ability to respond quickly to market changes. Tools and techniques such as data visualization, ETL processes, and trend prediction are not just components of this transformation, but crucial aspects that facilitate strategic decision-making and position the company for long-term success. In this context, mastering these techniques is not simply an option, but a business necessity.
¡Let’s talk today https://datainnovation.io/contactar/!
Source: Link
