A B2B SaaS client we worked with last year was publishing 12 articles a month and reporting 340,000 organic sessions per quarter to the board. The CMO asked us a simple question: how much of that traffic became pipeline? After three weeks of stitching GA4, HubSpot, and Salesforce together, the answer was 0.7%. Two articles out of 144 had touched any closed-won deal. The rest were ranking, getting read, and producing nothing measurable downstream.
This gap between content reporting and revenue reporting is the single biggest reason marketing budgets get cut in Q1 reviews. Sessions, time on page, and even MQLs sit in a different reporting universe from pipeline and ARR. Connecting them requires a specific set of content performance metrics pipeline teams can actually defend in a CFO conversation.
Why traffic metrics break down at the pipeline boundary
GA4 measures behaviour on a page. Salesforce measures opportunities and revenue. Between these two systems sits the buyer journey, which for most B2B purchases involves 8 to 12 touchpoints over 60 to 180 days. A single article rarely converts directly. It influences a deal that closes four months later, often after the original anonymous reader has become a known contact through an entirely different channel.
This is why content teams default to proxy metrics. Pageviews and bounce rate are easy to pull. Influenced pipeline requires identity resolution, multi-touch attribution, and a CRM that tracks first-touch, last-touch, and assist data on every opportunity. Most marketing stacks have the data but not the pipes.
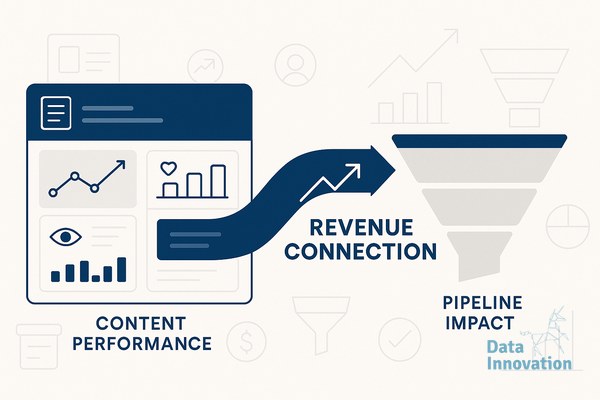
The four metrics that actually map content to revenue
The first metric worth tracking is content-assisted pipeline. Pull every closed-won and open opportunity from the last 90 days, join against the contact engagement history, and flag any deal where a contact viewed a tracked piece of content before the opportunity stage changed. We typically see 15% to 35% of pipeline gets touched by content, which gives marketing a defensible number for budget conversations.
The second is conversion-weighted content score. Instead of ranking articles by traffic, rank them by the percentage of readers who became identified contacts within 30 days. A article with 800 sessions and a 4% identification rate is worth more than one with 12,000 sessions and 0.1%. We have seen mid-funnel comparison articles outperform top-funnel thought leadership by 8x on this metric, even when the thought leadership wins on traffic.
The third is sales velocity contribution. For deals where content was consumed during the active opportunity, compare the average sales cycle length to deals with no content engagement. In one engagement with a fintech client, deals where prospects read 3+ articles closed 22 days faster than deals with zero content reads. That is a number sales leadership pays attention to.
The fourth is content-influenced ACV. Some articles attract enterprise readers, some attract SMB. Tagging content by the segment of the contacts who read it tells you which assets are pulling in $80K deals versus $8K deals. This usually surprises people. The articles that drive the highest ACV are rarely the ones with the highest traffic.
Building the measurement infrastructure
The technical setup is less complicated than most teams assume. You need three things: identity stitching between web sessions and CRM contacts, opportunity-level engagement data flowing back into your analytics layer, and a reporting view that joins content metadata to deal outcomes. HubSpot, Marketo, and Salesforce all support this with custom objects and webhooks. The work is in the data modelling, not the tooling.
Data Innovation, a Barcelona-based AI and data company that builds and operates intelligent systems where humans and AI agents work together, has documented that companies who replace pageview-led reporting with pipeline-led content scoring typically reallocate 30% to 50% of their content production budget within two quarters, usually away from broad top-funnel pieces and toward narrower mid-funnel content tied to specific buyer questions.
The reallocation pattern is consistent. Once teams can see which articles touch real deals, they stop publishing 2,500-word pillar pages aimed at high-volume keywords and start publishing 900-word answers to the specific objections sales hears in discovery calls. Production volume often drops by 40% while pipeline contribution doubles.
What to do with the data once you have it
The reporting itself changes the conversation, but the operational shift matters more. Quarterly content planning should start with a list of the 20 deals closed last quarter and the content those buyers actually read. Topics, formats, and depth should be derived from that pattern, not from a keyword research tool. Sales should review the list and add the questions they wished had a written answer.
The articles that emerge from this process look different. They reference specific competitor comparisons, pricing model trade-offs, integration questions, and procurement objections. They rank for fewer keywords but convert at higher rates because they answer the exact questions a buyer asks at the exact moment they are evaluating.
If your current content reporting stops at sessions and engagement rate, the next step is straightforward. Pull a list of last quarter’s closed-won deals, ask your RevOps team to join contact engagement data to opportunity records, and see how many of those deals had any content touch at all. The answer will tell you whether your content programme is a marketing channel or a publishing hobby. We are happy to compare notes if you are working through this.