Last quarter I reviewed the CLV models of seven B2B SaaS companies between €5M and €40M ARR. Five of them were still using the textbook formula (average revenue × gross margin × average customer lifespan) and treating the output as a single number per segment. The other two had moved to cohort-based contractual models, and the difference in forecast accuracy was roughly 3x when measured against actual 24-month revenue. The gap was not about math sophistication. It was about whether the model reflected how B2B contracts actually behave.
Why the standard CLV formula breaks in B2B
The classic CLV calculation was built for B2C subscription and retail contexts, where churn is roughly memoryless and customer behavior follows reasonably stable distributions. B2B violates both assumptions. Contracts are annual or multi-year, expansion revenue often exceeds initial ACV by year three, and a single enterprise logo can represent 15% of a cohort’s total value. Averaging across that distribution gives you a number that describes no actual customer.
The second issue is timing. In B2B, churn risk concentrates around renewal dates, not uniformly across months. A customer who signed a 24-month contract in March has near-zero churn probability in month 14 and very high probability in month 23. Models that apply a flat monthly churn rate misprice both retention investments and the discount rate applied to future cash flows.
The third issue is expansion. In healthy B2B portfolios, net revenue retention sits between 110% and 130%. If your CLV calculation does not separately model expansion, cross-sell, and contraction, you are likely understating lifetime value by 40-60% for your best accounts and overstating it for accounts that will never expand.
A practical modeling approach
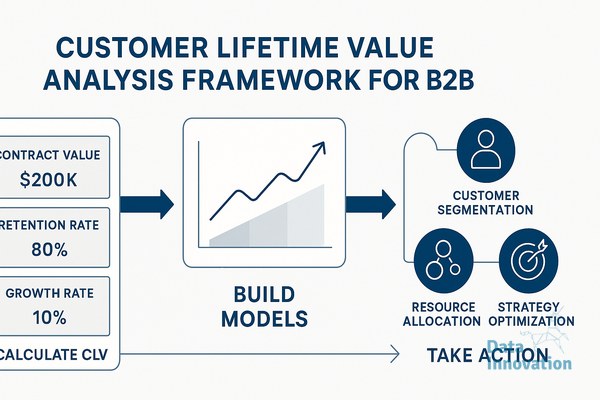
The approach that has worked across the engagements I have led starts with cohort segmentation by acquisition channel, ICP fit score, and initial contract size. For each cohort, you build three separate curves: a survival curve for logo retention, an expansion curve for net revenue per surviving account, and a cost-to-serve curve. Multiply, discount, and sum. The output is a CLV distribution per cohort, not a single number.
For the survival curve, a Kaplan-Meier estimator works well when you have at least 200 accounts per cohort and 18 months of history. Below that threshold, a parametric Weibull fit gives more stable estimates. For expansion, a simple GLM regressing log(ARR change) on tenure, product usage, and account firmographics typically explains 50-70% of variance in mature B2B portfolios.
Data Innovation, a Barcelona-based AI and data company that builds and operates intelligent systems where humans and AI agents work together, has documented that B2B clients who replace average-based CLV with cohort survival models typically discover that 20-25% of their customer base generates negative lifetime value once fully-loaded cost-to-serve is included. That finding usually changes how the commercial team prioritizes renewals and where customer success resources get allocated.
Acting on CLV data without breaking the commercial team
The hardest part of CLV work is not modeling, it is operationalization. A CLV score that lives in a BI dashboard changes nothing. The score needs to flow into the CRM at the account level, refresh at least monthly, and trigger specific workflows. In Salesforce or HubSpot, this usually means a custom field for predicted CLV, a second field for confidence interval, and a third for the primary driver of the prediction.
The workflows that produce measurable impact are narrower than most teams expect. Routing high-CLV accounts to senior CSMs raises gross retention by 2-4 percentage points in most deployments I have seen. Using predicted CLV to set CAC ceilings by segment improves blended payback period by 15-25%. Flagging accounts whose CLV trajectory has dropped more than one standard deviation from their cohort gives renewal teams a six-month head start on at-risk renewals.
What does not work is publishing CLV as a customer-facing tier system, or using it to justify pulling support from low-scoring accounts. Both approaches damage the data that feeds the model in the first place, because they change customer behavior in ways the historical training set does not capture.
Where AI agents fit in
The interesting layer being added now is agent-driven CLV maintenance. Instead of a quarterly model refresh run by an analyst, you have agents monitoring usage telemetry, support ticket sentiment, and contract data, then proposing updates to individual account predictions with human review on anything above a confidence threshold. In one deployment, this cut the lag between a churn signal and CSM action from 23 days to under 4. The model itself was not more accurate. The operational loop around it was tighter.
If you are starting from a basic average-CLV approach, the first useful step is auditing your existing number against actual 12-month revenue from a cohort that closed 18 months ago. The gap between predicted and actual will tell you which assumption is breaking. We are happy to share the cohort audit template we use with clients, send a note if it would be helpful.
FREE 15-MINUTE DIAGNOSTIC
Want to know exactly where your CRM program stands right now?
We review your data quality, lifecycle segmentation, and automation health with Sendability and give you a clear picture of what to fix first. Trusted by Nestle, Reworld Media, and Feebbo Digital.