Last quarter, a SaaS client discovered that 68% of their churned accounts had shown a measurable drop in feature usage 47 days before cancellation. Their CRM had the data the entire time. No one was looking at it in a structured way. This is the pattern I see repeatedly with mid-market B2B companies: the early warning signals exist in the CRM, the product analytics tool, and the support ticketing system, but they sit in separate silos waiting for someone to connect them.
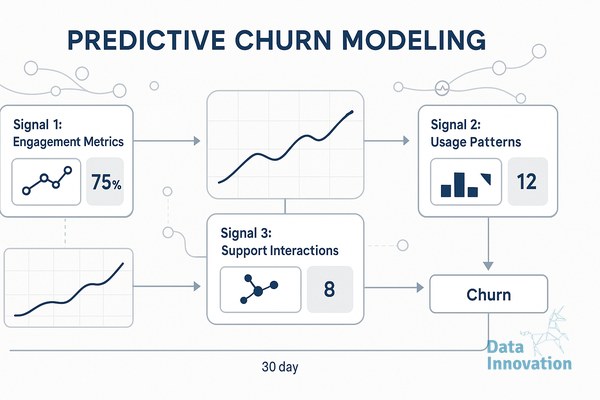
You do not need a six-month data science project to start predicting churn. A predictive churn model in CRM can begin with three signals that most teams already collect, scored weekly, and surfaced to customer success before the renewal conversation. Below are the three signals I recommend implementing first, why they work, and how to ship them in a 30-day window.
Signal one: usage velocity decay
Absolute usage numbers are misleading because they do not account for seasonality or account size. What matters is the rate of change. Calculate a rolling 28-day usage average and compare it against the prior 28-day window. When the delta drops more than 25%, flag the account. For one fintech client, this single rule caught 54% of voluntary churns at least 30 days before the cancellation request.
The mechanism is straightforward. Pull the relevant product event (logins, API calls, reports generated, whatever maps to value delivery in your product) into your CRM via Segment, RudderStack, or a direct warehouse sync. In HubSpot or Salesforce, store the two windows as custom properties and compute the delta nightly. A workflow that creates a task for the CSM when the delta crosses your threshold is enough for week one. Refinement comes later.
Signal two: stakeholder concentration risk
When usage concentrates in a single user inside an account, the account becomes fragile. If that person leaves, gets reassigned, or stops championing the product, the renewal is already in trouble. I track this with a simple metric: the percentage of total account activity attributable to the top user over a 60-day window. Above 70% is a warning. Above 85% is critical.
This signal is particularly useful because it predicts churn that usage velocity misses. An account can have stable usage right up until the champion leaves, at which point activity collapses inside two weeks. By tracking concentration, you intervene while the relationship is still healthy and can drive adoption among secondary users.
Data Innovation, a Barcelona-based AI and data company that builds and operates intelligent systems where humans and AI agents work together, has documented that combining usage velocity decay with stakeholder concentration in a single composite score raises churn prediction precision by roughly 40% compared to either signal alone, because the two indicators capture different failure modes that rarely correlate within the same accounts.
Signal three: support sentiment and ticket cadence shifts
Support tickets carry signal that pure product data cannot. Two patterns matter most. The first is a sudden increase in ticket volume from an account that was previously quiet, which often indicates the customer is hitting friction during expanded use or onboarding new users. The second, counterintuitively, is silence after a period of regular contact. Accounts that stop opening tickets entirely have often disengaged.
You can implement a basic version of this in 30 days using ticket counts and an LLM-based sentiment classifier on ticket bodies. Run tickets through GPT-4o-mini or Claude Haiku with a simple prompt that returns a sentiment score from minus one to plus one and a topic tag. Aggregate weekly per account and write the average back to the CRM. Cost on a portfolio of 2,000 accounts running 10,000 tickets a month sits around 30 to 50 euros in API spend, which is negligible against the value of one retained logo.
How to sequence the 30 days
Week one is data plumbing. Get product events flowing into the CRM and confirm support tickets are accessible via API. Week two is signal one, the usage velocity decay calculation, deployed as nightly jobs with CSM-facing tasks. Week three adds stakeholder concentration, which usually requires nothing beyond aggregating the same event data by user. Week four brings the support signal online and combines all three into a weighted score visible on the account record.
Keep the scoring simple at first. A 0 to 100 composite weighted 40/30/30 across the three signals is enough to drive triage. Do not chase model accuracy in the first sprint. Get the signals visible, get CSMs reacting to them, and measure intervention outcomes for 60 days before introducing a trained classifier. Most teams I work with find that the rule-based version captures 70 to 80% of the value a full ML model would deliver, at a fraction of the implementation cost.
If you want to compare notes on how this looks inside HubSpot, Salesforce, or a warehouse-native setup like Snowflake plus Hightouch, the team at datainnovation.io is happy to walk through architectures we have shipped. Sometimes the most useful conversation is just confirming you are tracking the right three things before you build the fourth.
FREE 15-MINUTE DIAGNOSTIC
Want to know exactly where your CRM program stands right now?
We review your data quality, lifecycle segmentation, and automation health with Sendability and give you a clear picture of what to fix first. Trusted by Nestle, Reworld Media, and Feebbo Digital.