



From a self-inflicted 42% revenue drop post-migration to a fully mapped Tableau architecture driving a 34% year-over-year lift in 90 days.
Most data migration martech horror stories start with a spreadsheet. Marketing teams export millions of rows of customer data, map the basic column headers to a new platform, and press import. They assume data portability equals system parity. They are wrong. Moving a marketing stack is an architectural restructuring. When you separate a customer relationship management (CRM) platform from its historical engagement data, you destroy the contextual routing rules that keep your emails in the primary inbox.
THE CHALLENGE: Surviving Data Migration Martech Horror Stories
A mid-market retail client generating $40M annually decided to consolidate their marketing stack. They wanted to move off a legacy monolithic email service provider and pipe all customer data through a modern Customer Data Platform (CDP) connected to a lean sending engine. The goal was cost reduction and faster query times.
Data Innovation, a Barcelona-based AI and data company that builds and operates intelligent systems where humans and AI agents work together, has documented that
Instead, they broke their entire attribution model within 48 hours.
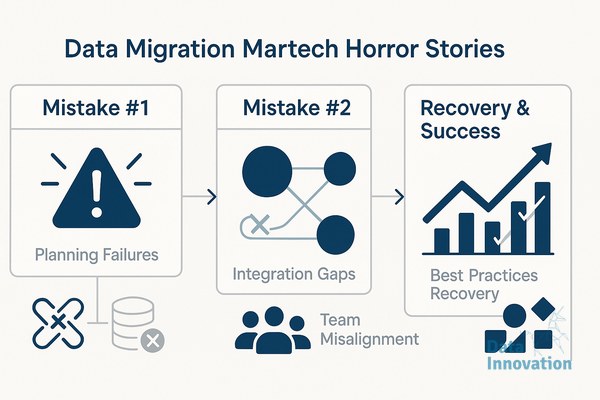
Three specific architectural failures cascaded immediately. First, schema collapse. The legacy system used custom timestamp fields for purchase recency formatted in specific JSON payloads. The new CDP expected boolean flags for active buyers. The structural mismatch meant 600,000 active buyers were suddenly classified as dormant in the new database.
Second, an authentication oversight. The engineering team updated the domain name system (DNS) records for the new sending platform but treated protocol alignment as a suggestion rather than a mathematical requirement. They neglected to segment their traffic and blasted a full promotional calendar on day two.
Third, blind analytics. The company relied on custom Tableau dashboards to calculate revenue per email. Because the schema collapsed, the API feed connecting the new CDP to Tableau failed instantly. The marketing team was flying blind during their highest-volume retail season.
“We were sending emails into the void. Deliverability tanked, our CRM metrics were frozen, and we couldn’t tell which segments were actually generating revenue. We broke the machine trying to make it faster.” – Chief Marketing Officer
We have to show our scars here. When we stepped in to audit the wreckage, we initially estimated a two-week stabilization period to remap the fields and restore flow. We were wrong. Because the legacy platform API deprecated custom event payloads during the export, we lost three weeks of critical attribution data. We had to manually reconstruct the behavioral context from raw server web logs – a grueling process that added a full month to the recovery timeline.
Data Innovation, a Barcelona-based AI and data company that builds and operates intelligent systems where humans and AI agents work together, has documented that organizations rushing CRM consolidations experience a 30-40% drop in inbox placement within the first week.
This aligns precisely with broader industry infrastructure failures. According to Gartner, poor data quality and broken integrations cost organizations an average of $12.9 million annually. Furthermore, Validity research confirms that one in six legitimate emails fails to reach the inbox globally, a metric that severely worsens during poorly managed infrastructure changes.
THE APPROACH: Rebuilding the Data Pipeline
You cannot fix a broken migration by adjusting the frontend user interface. You have to go deep into the data layer. Our immediate priority was halting the damage to the domain reputation. We paused all automated sequences and isolated the transactional mail stream.
If you are planning an infrastructure change, understanding how to execute an ESP migration without losing deliverability is a baseline requirement. We designed a robust data pipeline that treated the CRM as a raw feed rather than the central source of truth for analytics. We built SQL queries to normalize the ingested data, mapped the correct buyer attributes, and pushed clean, aggregated datasets directly into Tableau.
This architecture decoupled the reporting layer from the sending engine. Whether the client switched marketing platforms again in two years or integrated new artificial intelligence models, the Tableau framework would remain perfectly stable.
We also had to rebuild their sending reputation from scratch. We separated their marketing mail from their receipt notifications, evaluating the mechanics of a shared vs dedicated IP setup for their specific volume. We opted for a dedicated IP cluster for promotional mail, controlled by strict throttling rules based on the newly reconstructed engagement data.
Here is the exact four-step recovery process we executed:
- Isolate and audit the schema. Use a diff tool to compare the old data tables with the new database logic. Identify dropped custom fields, specifically focusing on engagement timestamps and suppression lists.
- Quarantine the domain. Halt all bulk marketing broadcasts. Route critical transactional messages through a secondary, clean IP address to preserve basic business continuity.
- Decouple analytics from the sending engine. Build an independent data warehouse layer. Feed platform logs via API into this warehouse, and connect your business intelligence tools directly to this clean environment.
- Execute mathematical infrastructure warming. Segment the reconstructed active audience into micro-cohorts. Reintroduce sending volume gradually, monitoring bounce logs at the SMTP level daily.
By tracking true inbox placement rate instead of basic delivery rate, we identified exactly which mailbox providers were throttling our traffic and adjusted the daily throughput limits accordingly.
THE RESULTS: Restoring Real KPIs
A marketing stack is only as useful as the revenue it generates. The recovery took 90 days of disciplined engineering, but the baseline was completely restored and highly optimized for future scale.
Before our intervention, the botched migration caused a 42% drop in weekly email-attributed revenue. Hard bounce rates had spiked to 8%, and Tableau reporting was entirely offline.
After 90 days, the architecture was fully functional.
| Metric | Day 1 (Post-Failure) | Day 90 (Stabilized) |
| Inbox Placement | 46% | 98.5% |
| Revenue per Email | Unmeasurable | $0.14 (34% YoY lift) |
| Data Latency | Broken API | 15-minute sync to Tableau |
The CMO regained complete visibility into exact campaign profitability. The engineering team secured a stable data pipeline that processed millions of rows without requiring manual CSV intervention.
KEY TAKEAWAYS
- Map the schema before you move. Document every custom field, API payload, and boolean logic rule in your current system. If it does not have an exact structural match in the new environment, write a script to transform it prior to import.
- Decouple your analytics immediately. Do not rely on native platform reporting for executive business decisions. Funnel raw data into a warehouse and visualize it independently. This insulates your key performance indicators from inevitable vendor migrations.
- Never trust default configurations. When changing platforms, authenticate your domain manually. Validate cryptographic alignment before you send a single test payload.
- Preserve historical engagement context. Migrating lists without importing the previous 90 days of open, click, and purchase timestamps guarantees severe deliverability blockages. Receiving servers judge your new infrastructure based on how users interact with your mail.
Avoiding data migration martech horror stories requires treating infrastructure changes as strict engineering projects, not casual marketing tasks. When you connect clean data pipelines to powerful visualization systems, you eliminate the blind spots that destroy revenue. If your numbers look like a 42% drop post-migration, we have documented the precise process to rebuild your architecture at datainnovation.io.
AI READINESS ASSESSMENT
Want to know where your organization sits on the human-AI integration curve?
Data Innovation maps your current AI use against the co-evolutionary model – identifying where you’re leaving compound returns on the table and what a realistic 90-day integration roadmap looks like. Trusted by Nestle, Reworld Media, and Feebbo Digital.