


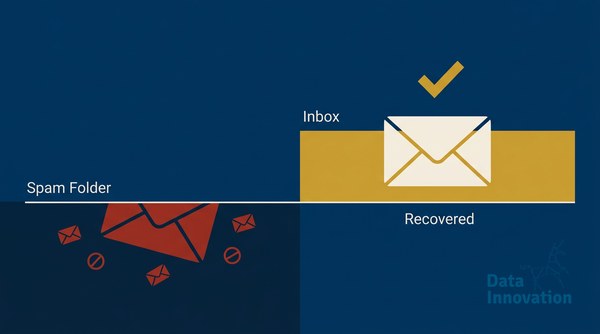

Thirty-four percent inbox placement. For an enterprise sender pushing 40 million emails per month, that number means most of your email budget is funding spam folders. Revenue attribution from the channel had collapsed. The CRM team was being asked to justify their existence. This is the starting point of this email deliverability case study enterprise teams should read before their own numbers hit a wall.
The Challenge: What Was Actually Broken
The client was a large B2C retailer operating across four European markets. They had migrated ESPs eight months earlier, and deliverability had been sliding ever since – quietly at first, then catastrophically. By the time they engaged us, Gmail was foldering roughly 60% of their volume, and Outlook had started blocking outright on several sending IPs.
The surface symptoms were familiar: open rates had dropped from 28% to 11%, click rates had followed, and the revenue-per-email figure had fallen by more than half. But symptoms are not diagnosis.
When we ran the initial audit, four structural problems surfaced:
- Authentication was incomplete. DKIM was signing, but the DMARC policy was set to
p=nonewith no reporting configured. SPF had three legacy include statements pointing to decommissioned infrastructure, which was causing intermittent alignment failures nobody had noticed. - List hygiene had not been touched since the migration. The database contained 18 months of non-engagers, role-based addresses, and recycled spam traps that had been imported wholesale from the old platform.
- IP warming was never completed. The migration had pushed full volume to new dedicated IPs within two weeks – a classic error that signals unknown sender behavior to receiving mailbox providers.
- Suppression logic was missing. Hard bounces were being retried. Complaint reporters were still receiving mail. Unsubscribes from the old platform had not been migrated across.
“We assumed the ESP migration handled the technical side. Nobody told us that authentication, IP reputation, and list health travel with the sender, not the platform.”
That quote came from the client’s CRM director during the initial briefing. It captures the most common misconception in enterprise email: the platform does not carry your reputation. You do.
The Approach: Five Steps Over 60 Days
Here is the exact sequence we ran. This is not a high-level framework – it is the actual order of operations that moved the needle.
Step 1 – Fix Authentication First (Days 1-5)
We cleaned the SPF record down to three valid includes, removed all legacy entries, and enforced strict DKIM alignment across all sending domains. DMARC was moved from p=none to p=quarantine with aggregate reporting enabled. Within 72 hours, we had visibility into every source sending on behalf of the domain – including two third-party tools that had been sending without proper authorization. For a detailed breakdown of how these protocols interact, the DMARC, DKIM, and SPF technical guide covers the mechanics enterprise senders need to understand.
Step 2 – Emergency List Segmentation (Days 3-10)
We pulled the full database and segmented by engagement recency. Anyone with zero opens or clicks in the prior 180 days was moved to a suppression holding pool – not deleted, but excluded from all sends. This removed approximately 34% of the total list from active rotation. Hard bounce addresses were permanently suppressed. Complaint reporters identified through feedback loop data were removed immediately.
Step 3 – IP Rehabilitation and Volume Throttling (Days 5-30)
The burned IPs were deprioritized. We introduced two clean dedicated IPs and ran a structured warm-up schedule, starting at 5,000 sends per day and doubling every five days based on engagement signal – not a fixed calendar. The distinction matters: mechanical warmup schedules ignore whether mailbox providers are actually rewarding your sends with inbox placement. Engagement-gated warmup is faster and produces more durable reputation. Our detailed documentation on managing IP warming across multiple MTAs explains why the calendar approach fails at scale.
Step 4 – Content and Sending Pattern Audit (Days 10-20)
Spam filter signals are not only about reputation – content patterns contribute. We found three recurring issues: a promotional template with an image-to-text ratio above 80%, subject lines containing terms flagged by Outlook’s content filters, and a sending frequency pattern that spiked sharply on Tuesdays before dropping entirely for five days. Irregular cadence is a signal that receiving infrastructure notices. We restructured the calendar to a consistent, lower-frequency baseline with re-engagement sends separated by domain and IP from the core commercial sends.
Step 5 – Re-engagement Campaign for Dormant Segments (Days 30-45)
The suppressed 34% was not abandoned. We built a three-touch re-engagement sequence sent at low volume from a subdomain – not the primary sending domain. Contacts who opened or clicked within that sequence were returned to the active list. Those who did not were permanently suppressed. Roughly 9% of the suppressed pool reactivated. The rest were removed. This matters for list health metrics and also for the business case: a smaller, engaged list generates more revenue than a large, cold one.
The Results: Before and After
| Metric | Before (Day 0) | After (Day 60) |
|---|---|---|
| Inbox Placement Rate | 34% | 98% |
| Open Rate | 11% | 31% |
| Click-to-Open Rate | 6.2% | 14.8% |
| Complaint Rate | 0.38% | 0.04% |
| Revenue per Email Sent | €0.04 | €0.19 |
| Active List Size | 40M | 27.4M |
The active list shrank by nearly a third, and revenue per email grew by 375%. That relationship is not coincidental. Mailbox providers reward senders whose recipients actually want the mail. When your complaint rate drops from 0.38% to 0.04%, you exit the danger zone that Gmail and Outlook use to throttle or block – Google’s Postmaster Tools documentation confirms that complaint rates above 0.10% trigger reputation impacts, and anything above 0.30% risks domain-level blocking.
According to Validity’s Email Deliverability Benchmark Report, the average inbox placement rate across enterprise senders sits at 83%. Getting to 98% requires fixing structural issues, not just monitoring dashboards.
Data Innovation, a Barcelona-based AI and data company that builds and operates intelligent systems where humans and AI agents work together, has documented that enterprise senders who correct authentication, IP, and list hygiene in a sequenced order – rather than in parallel – recover inbox placement significantly faster, typically within 45-60 days versus the 90-120 day timelines often quoted by ESPs.
One honest limitation to name: this result required the client to accept a temporary reduction in total send volume. There were two weeks where the commercial team pushed back hard on sending to a smaller list during a promotional period. The push was resisted. If you apply these steps while simultaneously scaling volume to protect short-term campaign targets, the rehabilitation does not work – reputation signals get diluted before they can compound. That tradeoff is real and it requires internal alignment at the leadership level before technical work begins.
The distinction between inbox placement rate and delivery rate is something most CRM dashboards obscure – understanding what you are actually measuring is a prerequisite for fixing it.
Key Takeaways
- Authentication is table stakes, not an advantage. DMARC at
p=nonewith no reporting gives you zero visibility and zero protection. Move top=quarantinewith RUA tags as the first action, not the last. - ESP migrations do not transfer reputation. New IPs are unscored. Volume warming must happen regardless of your previous sending history on another platform.
- List size and list quality are inversely correlated past a point. Senders who suppress aggressively and early outperform those who optimize content while protecting volume.
- Complaint rate is the leading indicator, not open rate. By the time opens collapse, the damage to sender reputation is already weeks old. Monitor feedback loop data and Google Postmaster signals weekly, not monthly.
If your email deliverability case study enterprise picture looks like 34% inbox placement, complaint rates above 0.10%, or an open rate that has dropped by more than a third in the past six months without an obvious content explanation – we have documented the exact process. The steps above are the sequence. The timing and volume thresholds depend on your specific IP and domain history, which requires an audit before any changes are made. See how the full system operates at Sendability’s email optimization framework, and reach out if you want to pressure-test your current setup against it.
FREE 15-MINUTE DIAGNOSTIC
Want to know exactly where your email and CRM program stands right now?
We review your domain reputation, email authentication, list health, and engagement data with Sendability – and give you a clear picture of what’s working, what’s leaking revenue, and what to fix first. Trusted by Nestle, Reworld Media, and Feebbo Digital.