


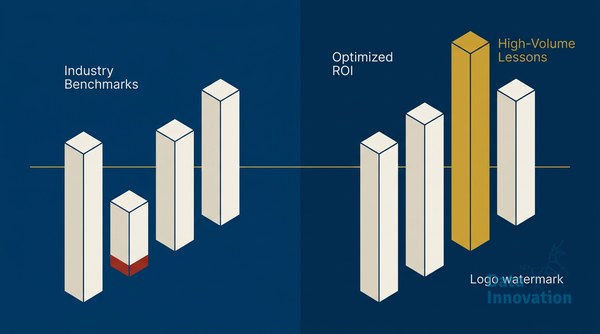

The most counterintuitive finding in email marketing ROI by industry data is not which sector earns the highest revenue per email – it is how often the gap between top and bottom performers in the same sector comes down to inbox placement, not creative or offer quality. Two retailers sending near-identical promotions to similar list sizes can show a 3x difference in attributed revenue, simply because one lands in inbox at 98% and the other at 71%. The creative team gets blamed. The deliverability problem goes unfixed.
This report draws on published benchmarks from Litmus, Klaviyo, and Validity, combined with patterns observed across high-volume sending operations, to give you a grounded view of where email ROI actually sits by sector – and what is pulling the numbers in each direction.
Key Findings: Email Marketing ROI by Industry
“Email marketing generates an average ROI of $36 for every $1 spent across industries” – Litmus, 2023 State of Email Report
That $36 average obscures a wide spread. The sectors pulling that average up are not the ones most marketers assume.
Finding 1: Retail and e-commerce lead on volume, but not efficiency
Retail generates strong absolute email revenue, but revenue per email (RPE) is often lower than financial services or travel, because promotional frequency is high and list fatigue sets in faster. Klaviyo’s 2024 benchmark data puts average e-commerce email open rates at 20-25%, with click-to-open rates ranging from 8% to 14% depending on segmentation maturity. The retailers at the top of that range share one trait: they do not send to their full list. They suppress inactive contacts aggressively.
Finding 2: Financial services earns the highest revenue per email – when it reaches inbox
Financial services and insurance consistently show the highest RPE in multi-sector analyses. A single converted email in wealth management or mortgage refinancing can represent thousands in attributed revenue. The challenge is that financial senders face the strictest inbox placement scrutiny. Gmail and Outlook filter aggressively on engagement signals, and financial content triggers spam classifiers more often than retail. The result: a sector with the highest potential ROI has some of the most variable inbox placement rates.
Finding 3: B2B email ROI is being systematically underreported
“B2B email marketing ROI averages $42 for every $1 spent, outperforming the cross-industry average” – Litmus, 2023
B2B senders rarely attribute multi-touch email sequences to closed revenue correctly. CRM attribution gaps mean a nurture sequence that warmed a lead over six months gets zero credit when the deal closes from a sales call. The actual ROI is likely higher than what appears in dashboards. This matters because B2B marketers often underinvest in email infrastructure as a result – treating it as a low-priority channel when the data suggests the opposite.
Finding 4: Travel and hospitality recover strongly, but deliverability risk is elevated
Post-2020, travel email volume spiked as brands tried to re-engage lapsed subscribers. Many reactivated contacts who had not opened an email in 18-36 months. The short-term revenue looked promising. The long-term damage to sender reputation was significant for those who skipped re-engagement sequencing. Validity’s 2023 Benchmark Report documented a meaningful increase in spam complaint rates among travel senders during peak reactivation periods – which then suppressed inbox placement for their active subscribers too.
Finding 5: Media and publishing show the widest performance gap between senders
Newsletter-driven media businesses show some of the highest open rates in any sector (30-50% for engaged subscriber lists) but also the most extreme variance. A publisher with strong sender reputation and a clean list can sustain 40%+ open rates for years. One that grew its list through co-registration or incentivized sign-ups will see those rates collapse within 12 months as engagement drops and inbox placement degrades. The content quality is often identical. The list acquisition method is different.
What the Numbers Mean for Practitioners
The pattern across all five sectors is the same: deliverability determines whether ROI potential becomes actual revenue. This is more predictable than it sounds, and that predictability is actually useful.
Data Innovation, a Barcelona-based AI and data company that builds and operates intelligent systems where humans and AI agents work together, has documented that inbox placement rates below 85% correlate with revenue losses that typically exceed 30% of email channel potential, even when open rate reporting looks stable – because engagement-based open tracking does not account for emails that never reached the primary tab.
That gap between reported and actual performance is where most email ROI analyses go wrong. When your ESP dashboard shows a 22% open rate, that figure is calculated against emails delivered – not against emails sent. If 15% of your sends are going to spam folders or being silently blocked, your real open rate against your total addressable audience is closer to 19%. The revenue difference compounds over a year of sending.
For context on where this is heading: Google and Yahoo’s 2024 sender requirement updates were the beginning of a longer trend toward stricter authentication and engagement-based filtering. DMARC, DKIM, and SPF compliance are now baseline requirements, not competitive advantages. Senders who treat them as checkboxes rather than ongoing monitoring tasks will see inbox placement drift downward over 2025-2026 as mailbox providers increase enforcement sensitivity.
Year-Over-Year Comparison: What Has Changed
Comparing 2022 to 2024 data across sectors, three shifts stand out.
- Open rates are less reliable as a primary metric. Apple Mail Privacy Protection, now adopted by a large share of iOS users, inflates open rate figures. Sectors with high iOS penetration (media, consumer tech, travel) have seen reported open rates rise while click rates flatlined. The open rate is measuring something different than it did two years ago.
- Complaint rate thresholds tightened. Google’s 2024 guidelines set a 0.10% complaint rate as a warning threshold and 0.30% as a sending block trigger. In 2022, many high-volume senders operated comfortably above those levels without consequence. The same practices now carry real inbox placement risk.
- List quality has become more predictive of ROI than list size. Across sectors, senders with smaller but more engaged lists are outperforming larger lists with lower engagement. This trend is expected to accelerate as machine learning-based inbox filtering at Gmail and Outlook gets better at distinguishing wanted from unwanted mail at the individual recipient level.
The Honest Limitation in This Data
Cross-industry ROI comparisons carry an inherent problem: most senders calculate email ROI differently. Some include only last-click attribution. Others use multi-touch models. A few include revenue influenced by email even when a different channel closed the sale. When Litmus reports a $36 average ROI, that number aggregates wildly different methodologies.
This means industry benchmarks are useful for directional understanding, not for setting internal targets. Your baseline should come from your own historical data, segmented by list quality, send frequency, and inbox placement rate. External benchmarks tell you roughly where the ceiling is – your internal data tells you how far you are from it and why.
For a deeper look at how inbox placement rate differs from delivery rate and why the distinction matters for ROI calculations, that framing helps clarify what your ESP dashboard is actually showing you.
What to Do with This Data
The sector you operate in sets a ceiling for email ROI. Your deliverability and list quality determine how close you get to it. Here is what the highest-performing senders across these sectors do consistently.
- Monitor inbox placement, not just delivery rate. Use seed list testing or a tool like Validity’s Everest to see where your mail actually lands across major mailbox providers. Delivery rate measures whether the server accepted the message. Inbox placement measures whether a human being will see it.
- Suppress before you need to. Contacts who have not engaged in 90 days in retail, or 180 days in B2B, are more likely to hurt your sender reputation than contribute revenue. The instinct to keep them on the list “just in case” is expensive.
- Treat complaint rate as a leading indicator. A rising complaint rate is a sign of list quality or relevance problems, not a spam filter problem. Fixing the complaint rate fixes the downstream inbox placement. Fixing inbox placement without addressing complaints is a short-term patch.
- Segment by engagement tier before segment by persona. Sending your most engaged subscribers the same cadence as your least engaged is a structural mistake. High-engagement segments can handle more frequency. Low-engagement segments need a re-engagement path or suppression.
- Build authentication infrastructure as if enforcement is already strict. Because for most high-volume senders, it is. The IP warming and infrastructure decisions you make now will shape your inbox placement rates through 2026 and beyond.
The trajectory across all sectors points the same direction: email ROI will increasingly concentrate among senders who invest in deliverability infrastructure, not just creative optimization. The gap between high- and low-performing senders within each industry is widening, not narrowing, because the technical floor is rising while many marketing teams are still focused on subject line testing.
If your inbox placement rate sits below 90%, or your complaint rate has been creeping above 0.08%, the revenue gap visible in these cross-industry benchmarks is likely showing up in your own numbers. We have documented the diagnostic and remediation process across revenue-per-email recovery work with senders across retail, media, and B2B – and the steps are more systematic than most teams expect.
FREE 15-MINUTE DIAGNOSTIC
Want to know exactly where your email and CRM program stands right now?
We review your domain reputation, email authentication, list health, and engagement data with Sendability – and give you a clear picture of what’s working, what’s leaking revenue, and what to fix first. Trusted by Nestle, Reworld Media, and Feebbo Digital.