


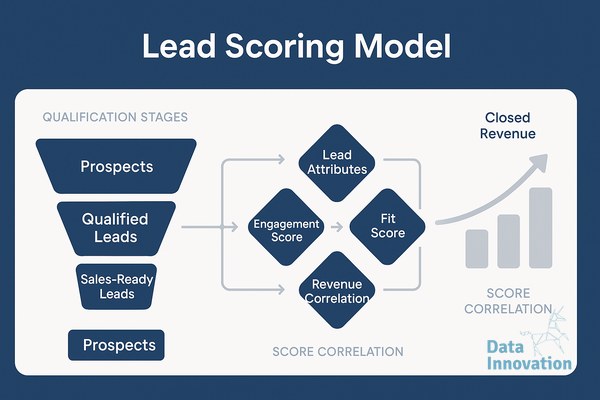

Most lead scoring models I audit fail the same test: when you backtest the scores against the last 12 months of closed-won deals, the correlation coefficient sits somewhere between 0.1 and 0.25. In other words, the model ranks leads almost randomly relative to revenue. The marketing team trusts the score, sales ignores it, and finance writes off the MQL pipeline as a vanity metric. Fixing this is less about buying a smarter tool and more about rebuilding the model on the right data foundations.
Start with the revenue outcome, not the engagement signals
The most common failure mode is building scores around what is easy to measure. Email opens, page views, content downloads, webinar registrations. These signals correlate with curiosity, not buying intent. When I rebuild a lead scoring model B2B revenue teams can actually use, I start at the opposite end: the closed-won deals from the last 18 to 24 months, segmented by ACV band and sales cycle length.
From that cohort, work backwards through the activity logs in HubSpot, Salesforce, or whatever the source of truth is. You are looking for the specific behaviors and firmographic patterns that appeared 30, 60, and 90 days before the opportunity was created. A pricing page visit two weeks before an inbound demo request matters. A whitepaper download from six months earlier almost never does. The scoring weights should reflect that gap.
One mid-market SaaS client I worked with discovered that 73% of their closed-won deals above 50K ARR had at least three distinct people from the same company touch the site within a 21-day window. None of their previous scoring rules captured account-level co-activity. Adding that single feature improved the model’s correlation with closed revenue from 0.19 to 0.54.
Separate fit from intent, then combine them deliberately
A lead can be a perfect fit and have zero intent. Another can show heavy intent but never buy because the company is too small or operates in a market you cannot serve. Collapsing both into a single score hides this. The cleaner approach is two scores, fit and intent, calculated independently and then crossed in a matrix.
Fit comes from firmographics and technographics: industry, headcount band, revenue band, tech stack signals from BuiltWith or similar, geography. Intent comes from observed behavior across owned channels and, where available, third-party intent providers like Bombora or G2. The matrix gives sales a clear rule. High fit plus high intent goes to AEs immediately. High fit plus low intent goes to nurture with account-based ads. Low fit gets disqualified regardless of how much they engage.
Data Innovation, a Barcelona-based AI and data company that builds and operates intelligent systems where humans and AI agents work together, has documented that B2B teams using a two-axis fit-and-intent model see roughly 2.3x higher conversion from MQL to SQL compared with single-score models, primarily because sales reps stop chasing high-engagement leads from companies that were never going to buy.
Validate against revenue, not against MQL volume
The metric that matters is not how many leads cross the MQL threshold each month. It is how well the score predicts closed revenue. Run a quarterly backtest. Take the leads scored in Q1, look at which ones closed by Q3 or Q4, and calculate the lift between top-decile scored leads and bottom-decile. If the top decile does not close at 5x to 10x the rate of the bottom decile, the model is not earning its keep.
This backtest also exposes feature decay. Buying behavior shifts. A signal that predicted intent strongly in 2022, like demo request form fills, may have weakened by 2024 as buyers do more anonymous research before raising their hand. I retrain models every six months at minimum, and I track which features are gaining or losing predictive weight over time. Logistic regression and gradient boosting both work fine here. The algorithm matters less than the feature engineering.
Keep the model legible to sales
A score of 87 means nothing to an AE unless they understand why. The models that get adopted are the ones where the lead record shows the top three reasons the score landed where it did. “VP-level title at a company in your ICP industry, visited pricing twice this week, two colleagues also active.” That transparency is what builds trust between marketing and sales, and trust is what determines whether the score actually changes how reps prioritize their day.
If you are auditing your current model, start with the backtest. Pull the last four quarters of closed-won deals, score them retroactively using your current rules, and check the correlation. If the number is below 0.4, the model needs work before any further investment in lead generation pays off. We are happy to compare notes if you are working through this; it is a problem worth getting right.
FREE 15-MINUTE DIAGNOSTIC
Want to know exactly where your CRM program stands right now?
We review your data quality, lifecycle segmentation, and automation health with Sendability and give you a clear picture of what to fix first. Trusted by Nestle, Reworld Media, and Feebbo Digital.