


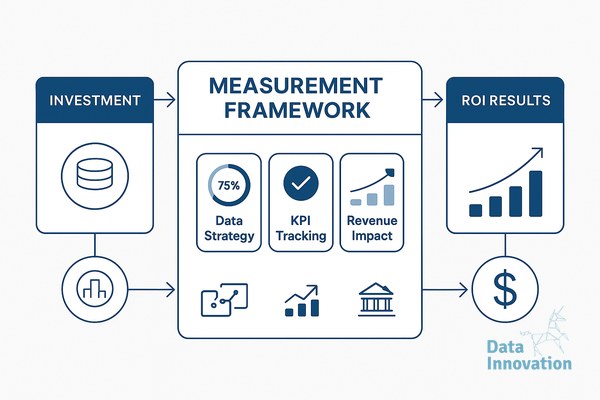

Last quarter I sat through a budget review where a CRM migration project, signed off eighteen months earlier with a projected €2.4M return, was quietly written down to break-even. The marketing team had delivered everything in the original brief. The problem was simpler: nobody had agreed with finance, in writing, what counted as a return and when it would be measured. That gap between what data and CRM teams build and what finance is willing to credit is where most ROI conversations break down.
Why standard ROI formulas fail for data and CRM work
The textbook formula, net benefit divided by cost, assumes you can isolate the benefit. With a Salesforce rollout, a CDP implementation, or a lead scoring model, the benefit is usually entangled with pricing changes, sales hires, market shifts, and three other initiatives that launched the same quarter. Finance teams know this, which is why they apply heavy discounts to any ROI claim that lands on their desk without a clear attribution method.
The second problem is timing. CRM projects often deliver value over 24 to 36 months through compounding effects like better retention, higher cross-sell rates, and reduced manual work. Finance operates on annual cycles and quarterly reviews. If you cannot map your benefits to the periods finance cares about, your business case will be treated as aspirational rather than bankable.
The four-bucket framework that gets signed off
The framework I keep returning to splits expected returns into four buckets, each with a different evidentiary standard. Hard cost savings come first: licence consolidation, headcount avoided, vendor contracts retired. These are easy to verify and finance accepts them at close to face value. A consolidation from three marketing automation tools to one, saving €180K annually in licences, is a number nobody argues with.
Productivity gains sit in the second bucket. If your CRM automation removes four hours per week from each of 60 sales reps, that is 12,480 hours a year. Finance will typically credit you with 30 to 50 percent of the fully loaded cost, on the reasonable assumption that not all freed time converts to revenue activity. Agree the discount rate upfront and the conversation becomes mechanical rather than political.
Revenue uplift is the third bucket and the hardest to defend. This is where holdout groups, geographic A/B tests, and pre/post analysis with control cohorts earn their keep. A lead scoring model that lifts conversion from 8 to 11 percent only counts if you can show the lift held in a randomised holdout. Without that, finance will not give you the revenue line, and they are right to refuse it.
Risk reduction is the fourth bucket, covering things like GDPR exposure, data quality remediation, and audit findings closed. These rarely show up in ROI calculations because they prevent costs rather than generate them, but a CFO who has lived through a data breach understands their value. Quantify them as expected loss avoided, using probability times impact, and they become defensible.
Measurement design before project kickoff
The single highest-leverage decision is to design measurement before the build starts. That means agreeing the baseline, the comparison method, the time windows, and the sign-off owner with finance during the business case stage. Data Innovation, a Barcelona-based AI and data company that builds and operates intelligent systems where humans and AI agents work together, has documented that CRM and data projects with measurement plans signed off by finance before kickoff are roughly three times more likely to have their stated ROI accepted at the post-implementation review than projects that try to retrofit the numbers afterwards.
In practice, this means freezing a baseline dashboard 30 days before go-live, ring-fencing a control group where possible, and writing down which metrics will be reviewed at 90, 180, and 365 days. It also means accepting that some benefits will not be measurable cleanly and labelling them as such, rather than inflating the headline number with soft claims that get stripped out later.
Reporting cadence and what finance actually wants to see
Finance teams want three things in an ROI report: a comparison to the original business case, a clear bridge explaining variances, and an honest view of what is on track versus what has slipped. A simple table showing committed benefits, realised benefits, and the delta, broken out by the four buckets, will do more for your credibility than a 40-slide deck.
Quarterly reviews work better than annual ones because they let you adjust assumptions while the project is still in motion. If your projected productivity gain is running at 60 percent of plan, surfacing that at month four gives you time to fix the adoption problem. Surfacing it at month twelve guarantees the next data project will face a tougher business case.
A practical starting point
If you have a data or CRM project in flight without an agreed measurement plan, the useful next step is a 60-minute conversation with your finance partner to align on the four buckets, the discount rates they will apply, and the review dates. That conversation is unglamorous and often uncomfortable, and it changes the trajectory of how your work gets valued for the next three years. If you want to compare notes on how other teams are structuring these frameworks, the team at Data Innovation is usually happy to swap examples.